Project Management
MGMT 306
Purdue University
CPM / PERT
- Critical Path Method (CPM)
- Program Evaluation and Review Technique (PERT)
- Techniques for scheduling lists of tasks (project) with many interdependencies
Example Applications
- Construction projects such as office buildings, highways, sports facilities
- Design and installation of new systems such as computer software or the launching of a rocket
- Designing and marketing a new product
- Completing a corporate merger or a movie production
- Organization of large-scale events such as the Olympics, World Cup, or political summits
- Building a large ship or passenger airplane
The Scheduling LP
Building a house
- List of tasks to complete, their predecessors (prerequisites), and durations
- Question: When should we start each task to complete the task as early as possible?
| Activity | Predecessors | Duration (days) |
|---|---|---|
| A. Build foundation | 5 | |
| B. Build walls and ceilings | A | 8 |
| C. Build roof | B | 10 |
| D. Put in windows | B | 3 |
| E. Do electrical wiring | B | 5 |
| F. Paint house | C, D | 4 |
Project Network
- An arrow (arc) from one node to another node indicates a precedence relation
- Include an arrow from “Start” to any nodes without incoming arrows
- Include an arrow from any node without outgoing arrows to “End”

LP Model
Variables: When should we start each task? \[\begin{aligned} x_i & \qquad \text{start time of task $i$ for $i = A,B,C,D,E$}\\ D & \qquad\text{total duration of project} \end{aligned}\]
Objective: \[\begin{aligned} \min\quad&D&&\text{(total duration of project)} \end{aligned}\]
Constraints:
- For any activity without predecessors (connected to start), start time must be after time 0 \[\begin{aligned} x_A \geq 0 \end{aligned}\]
LP Model Continued
- Constraints continued:
- For any arc between activities, the succeeding activity must start after the preceding activity ends \[\begin{aligned} &x_A + 5 \leq x_B\\ &x_B + 8\leq x_C\\ &x_B + 8\leq x_D\\ &x_B + 8\leq x_E\\ &x_C + 10\leq x_F\\ &x_D + 3\leq x_F \end{aligned}\] These need to be put into standard form still
LP Model Continued
- Constraints continued:
- For any arc without successors (connected to finish), the ending time must be before the claimed duration \[\begin{aligned} x_F + 4 \leq D\\ x_E + 5 \leq D \end{aligned}\] These need to be put into standard form still
Spreadsheet Model
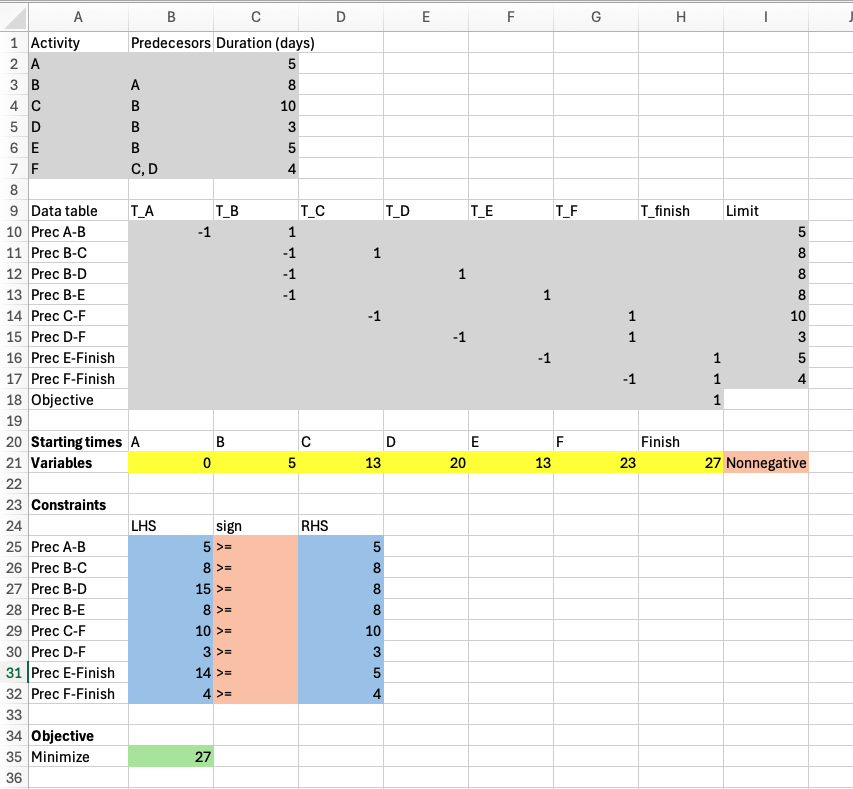
Scheduling LP Practice
- With a partner, draw the project diagram and write the LP model minimizing the completion time for the following software development project:
| Activity | Predecessors | Duration (days) |
|---|---|---|
| A. Gather requirements | - | 3 |
| B. Design database schema | A | 2 |
| C. Design user interface | A | 3 |
| D. Set up bakcend architecture | A | 2 |
| E. Implement database layer | B, D | 4 |
| F. Implement frontend scheme | C | 5 |
| G. Integrate frontend and bakcend | E, F | 3 |
| H. System testing | G | 4 |
Connections to CPM and PERT
- This LP is actually very simple
- Simple enough to solve by hand: Critical Path Method
- Serves as basis for more interesting questions:
- If task durations are random, what is the distribution of project completion times? Program Evaluation and Review Technique
- If task durations can be reduced by spending additional resources, what tasks should we crash? Project Crashing
The Critical Path Method
The Critical Path
- In the Linear Program solution, there is a critical path
- Start – A – B – C – F – Finish
- Every constraint along this path is a binding constraint
- The critical path tells us we cannot decrease the duration of the project any further
- We can solve the LP by hand by determining this critical path
The Critical Path Method Setup
- Draw network where each activity is represented as a grid of 6 cells
- Top-left cell is name of activity
- Bottom-left cell is duration of activity

The Critical Path Method Forward Pass
- Work from left-to-right
- Top-middle cell is earliest start time of each task
- Top-right cell is earliest end time of each task

The Critical Path Method Backward Pass
- Work from right-to-left
- Bottom-right cell is latest end time of each task to keep finish time
- Bottom-middle cell is latest start time of each task to keep finish time

Computing the Slack and Critical Path
- Compute the slack: Difference between Earliest/Latest start time
- Find critical path: Path from start to finish along 0 slack activities

Interpreting the slack and critical path
- Activities along the critical path:
- If that activity takes longer to complete than expected, the entire project completion will be delayed
- If that activity completes faster than expected, the entire project completion will come earlier
- Activities with positive slack:
- How much the duration can increase before it affects the project completion time
- How much you can delay starting on that activity without affecting projection completion time
Practice
- With a partner, complete the CPM for the project network in this week’s handouts
Program Evaluation and Review Technique
Uncertain activity times
- For new or unique projects, such as new product development or movie production, activity times will be uncertain
- We may deal with this by representing each activity duration by a random variable and assuming a probability distribution for it
- Three-time estimate approach
- For each activity, estimate the following times: \[\begin{aligned} a &= \text{the optimistic time (min duration)}\\ m &= \text{the most likely time (normal duration)}\\ b &= \text{the pessimistic time (max duration)} \end{aligned}\]
Beta distribution
- Assume the time to complete an activity follows a beta distribution
- “1-4-1” rule
- For each activity, mean completion time \[ t = \frac{a+4m+b}{6}\]
- For each activity, variance of completion time \[ \sigma^2 = \left(\frac{b-a}{6}\right)^2\]
PERT Method
- Step 1: Complete the CPM using the mean completion time for each activity
- Step 2: Identify the activities along the critical path
- Step 3: Overall project completion time has a normal distribution with
- mean equal to the sum of the mean completion times along the critical path
- variance equal to the sum of the variances along the critical path
PERT Assumptions
- When does this make sense?
- Durations of activities on critical path are independent (so variance of the critical path is sum of the variances)
- There are many activities on the critical path (so that the distribution looks normal)
- Non-critical activities are unlikely to become critical despite random durations (large slacks)
Example
- Consider the following project
- Compute the mean and variance for the project completion time using PERT
| Activity | Immediate Pred. | Optimistic | Most likely | Pessimistic |
|---|---|---|---|---|
| A | 3 | 5 | 7 | |
| B | 6 | 7 | 8 | |
| C | A, B | 3 | 7 | 8 |
| D | B | 1 | 5 | 6 |
| E | 3 | 4 | 5 | |
| F | C, D | 4 | 7 | 10 |
| G | D, E | 2 | 6 | 7 |
Example questions
Assume that the PERT assumptions hold
What is the probability that the project is completed in at most 21 hours?
What is the probability that the project is completed between 21 and 24 hours?
Hint You may need to use a new formula
=norm.dist(x, mean, st_dev, true)
Computes probability that a normal random variable withmeanandst_devis at mostx
Project Crashing
Time-Cost Trade-Offs
- In many applications, there is a deadline for the project
- In order to meet the deadline, it may be necessary to shorten selected activity times (crashing)
- Crashing is the act of spending resources to reduce the duration of a task
- In Project crashing problems, our goal is to minimize the resources spent (crashing costs) required to meet a deadline
Project Crashing Setup
- For most applications, each activity will have a: \[\begin{aligned} &t_i\quad\text{Normal time to complete activity}\\ &c_i\quad\text{Normal cost to complete activity}\\ &t'_i\quad\text{Crashed time to complete activity}\\ &c'_i\quad\text{Crashed cost to complete activity} \end{aligned}\]

Example
- Normal and crash activity data for a project
- What is the minimum crashing cost to finish the project in 10 days?
| Activity | Im. Pred. | Normal Time | C. Time | Normal Cost | C. Cost |
|---|---|---|---|---|---|
| A | - | 7 | 4 | $500 | $800 |
| B | A | 3 | 2 | $200 | $350 |
| C | - | 6 | 4 | $500 | $900 |
| D | C | 3 | 1 | $200 | $500 |
| E | B, D | 2 | 1 | $300 | $550 |
Computing Unit Crash Costs and Maximum Crash Amounts
- From these numbers, we can compute \[\begin{aligned} M_i &= t_i - t'_i\quad\text{Maximum reduction time}\\ K_i &= \frac{c'_i - c_i}{M_i}\quad\text{Cost per unit reduction} \end{aligned}\]
| Activity | Im. Pred. | Normal Time | … | Max crash amt | Unit crash cost |
|---|---|---|---|---|---|
| A | - | 7 | … | 3 | $100 |
| B | A | 3 | … | 1 | $150 |
| C | - | 6 | … | 2 | $200 |
| D | C | 3 | … | 2 | $150 |
| E | B, D | 2 | … | 1 | $250 |
Project Crashing LP Variables and Objective
- We will modify the project scheduling LP
- Variables \[\begin{aligned} T_i & \qquad \text{start time of task $i$ for $i = A,B,C,D,E$}\\ C_i & \qquad\text{amount (time) to crash task $i$ for $i=A,B,C,D,E$} \end{aligned}\]
- Objective \[\begin{aligned} \min\quad 100 C_A + 150 C_B + 200 C_C + 150 C_D + 250 C_E\quad\text{(total crash costs)} \end{aligned}\]
Project Crashing LP Constraints
- Constraints:
- For any activity without predecessors (connected to start), start time must be after time 0 \[\begin{aligned} T_A, T_C \geq 0 \end{aligned}\]
LP Model Continued
- Constraints continued:
- For any arc between activities, the succeeding activity must start after the preceding activity ends \[\begin{aligned} &T_A + 7 - C_A \leq T_B\\ &T_C + 6 - C_C \leq T_D\\ &T_B + 3 - C_B \leq T_E\\ &T_D + 3 - C_D \leq T_E \end{aligned}\] These need to be put into standard form still
LP Model Continued
- Constraints continued:
- For any arc without successors (connected to finish), the ending time must be before the deadline \[\begin{aligned} T_E + 2 - C_E \leq 10 \end{aligned}\] These need to be put into standard form still
LP Model Continued
- Constraints continued:
- Crash amount must be nonnegative and at most the maximum crash amounts: \[\begin{aligned} C_A &\leq 3\\ C_B& \leq 1\\ C_C&\leq 2\\ C_D&\leq 2\\ C_E&\leq 1\\ C_i&\geq 0 \quad\text{for all $i=A,B,C,D,E$} \end{aligned}\]
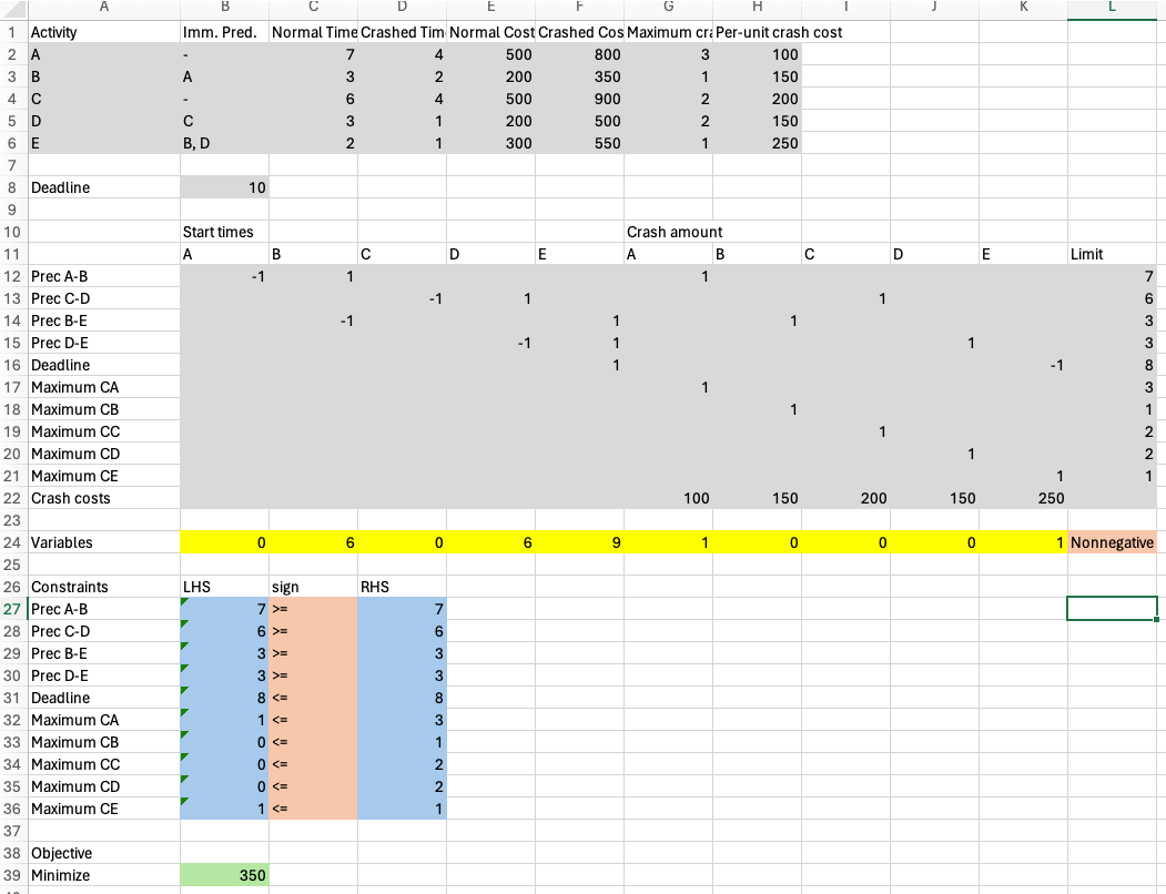
Spreadsheet model
Sensitivity analysis problem 1
Question. How does the optimal crashing cost change if the deadline is increased to 11 days?
Solution. The deadline constraint has a shadow price of -250 and an allowable increase of 1. Thus, the crashing cost would decrease by 250.
Sensitivity analysis problem 2
Question. How does the optimal crashing cost change it task B’s times change to normal time 5 and crashed time 4 (costs unchanged)?
Solution. This change would increase the RHS of the B to E precedence relation by 2. As 2 is within the allowable increase and the shadow price of this constraint is 100, this will increase our optimal crashing costs by 200.
Sensitivity analysis problem 3
Question. How does optimal crashing cost change if task A’s per unit crash cost increases to $150?
Solution. The range of optimality of the CA variable is [100,150]. Thus, the optimal crashing cost will crease by 1 * 50 = 50.
Practice Problems
Taken from S25 Homework
Practice problem - PERT
Project consists of the following 10 beta-distributed activities and their parameters measured in weeks.
| Activity | Description | Predecessors | Optimistic | Most Likely | Pessimistic |
|---|---|---|---|---|---|
| A | Market Research | – | 4 | 6 | 10 |
| B | Product Design | A | 5 | 8 | 11 |
| C | Competitive Analysis | A | 3 | 5 | 9 |
| D | Prototype Development | B | 4 | 7 | 10 |
| E | Manufacturing Setup | B | 6 | 9 | 12 |
| F | Focus Group Testing | C | 2 | 4 | 6 |
| G | Marketing Strategy Development | C, D | 5 | 7 | 9 |
| H | Final Product Adjustments | F | 3 | 4 | 8 |
| I | Marketing Launch Plan | G, H | 2 | 5 | 8 |
| J | Product Launch | E, I | 1 | 2 | 4 |
Practice problem - PERT Questions
Create the network diagram and complete it with a forward pass and a backward pass. Complete the CPM with the expected durations.
- Calculate the expected time and variance for each activity using the PERT formula.
- What is the expected time of completion (TOC)? What is the variance of the project?
- What is the critical path?
- What is the probability that the project can be completed in less than 35 weeks?
- What is the probability that the project can be completed between 32 and 38 weeks?
Practice problem - Project Crashing
The following project must be crashed at lowest crash cost to complete within 40 weeks:
| Activity | Description | Predecessors | Normal Duration (weeks) | Crashed Duration (weeks) | Normal Cost ($K) | Crashed Cost ($K) |
|---|---|---|---|---|---|---|
| A | Write Script | – | 10 | 7 | 50 | 65 |
| B | Cast Actors | A | 6 | 4 | 30 | 40 |
| C | Secure Filming Locations | A | 8 | 5 | 40 | 55 |
| D | Set Design | C | 7 | 5 | 35 | 45 |
| E | Rehearsals | B | 5 | 3 | 25 | 35 |
| F | Filming | D, E | 12 | 9 | 100 | 130 |
| G | Editing | F | 6 | 4 | 50 | 65 |
| H | Soundtrack Production | F | 5 | 3 | 30 | 45 |
| I | Final Cut & Review | G, H | 4 | 2 | 20 | 30 |
Practice problem - Project Crashing Instructions
Provide the cost minimization LP formulation in a textbox. A network diagram is not required.
- Calculate the maximum crash time (\(M_i\)) and unit crash cost (\(K_i\)) for each activity.
- Formulate an LP model to crash this project to 40 weeks.
- Build an Excel spreadsheet model of the product. What is the minimum cost for crashing this project? What is the optimal solution? Please provide your answers in a separate textbox.